Managing Azure Monitor Datasources in Grafana automatically with Terraform
Problem
Working with Grafana we recently discovered this datasource: Azure Monitor Datasource, which covers most of the monitor use cases we have on our Azure environments (Application Insights for app’s metrics and Azure Monitor API for system metrics). Since we are already using terraform grafana provider to provision our Grafana installation with standard datasources (such as Prometheus) and custom dashboards, we gave this custom datasource a go.
Given the fact this datasource is not a standard one, sadly it’s not covered by current fields that resource data_source provides out of the box. Checking Azure datasource documentation, we will need to make use of both json_data and secure_json_data but in a different way than terraform does: we don’t require auth_type, default, access_key and secret_key, in fact, we need new fields like client_id, tenant_id, etc. so we cannot use this terraform resource straight away.
NOTE: you need to install Azure Monitor Datasource in advance. Have a look at Grafana documentation in order to install plugins on your current server (using grafana cli, docker env variables, etc).
Workaround: API calls
Grafana provides an HTTP API we can use to handle our custom datasources. Default values for Azure Datasource parameters:
- type: grafana-azure-monitor-datasource
- access: proxy
- url: https://management.azure.com
- basicAuth: false
and require parameters:
- Application Insights
- appInsightsAppId
- appInsightsApiKey
- Azure Monitor API
- clientId
- subscriptionId
- tenantId
- clientSecret
One datasource can cover both (Insights and Monitor API) or just one of the endpoints. To create a new datasource, we need either authorization token or user/pass (seek Grafana documentation) to authorize our requests. A simple scenario using auth token:
curl -H "Content-Type: application/json" -H "Authorization: Bearer MyUltraSecretTokenForGrafana" -X POST -d @azure-insights-datasource.json http://127.0.0.1:3000/api/datasources
where the content of azure-insights-datasource.json is:
azure-insights-datasource.json
{
  "name": "AzureTest",
  "type": "grafana-azure-monitor-datasource",
  "access": "proxy",
  "url": "https://management.azure.com",
  "basicAuth": false,
  "isDefault": false,
  "jsonData": {
    "appInsightsAppId": "xxxxxxxxx-xxxx-xxxx-xxxx-xxxxxxxxxxx"
  },
  "secureJsonData": {
    "appInsightsApiKey": "abcd1234efgh5678jklm9012nopq"
  }
}
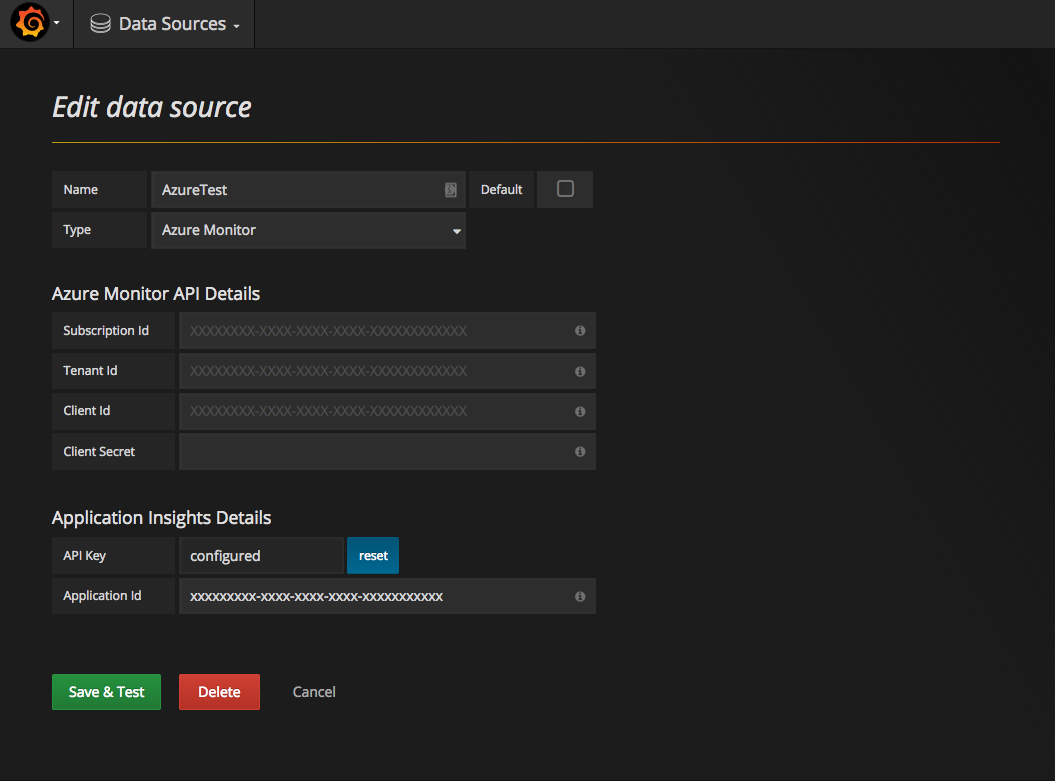
this creates a new Azure Monitor datasource as follow:

Adding Azure Monitor API fields we can update our datasource to fetch both App Insights and Monitor metrics.
And now in Terraform
First, let’s say we need terraform code to provision grafana (default datasources, custom dashboards, etc.). Define a provider specifying url and auth (token, previously generated) as follow:
provider "grafana" {
  url  = "http://127.0.0.1:3000/"
  auth = "eyJrIjoic29mRkF6bUxCTXV4a3U5Tk5Rb0U0a1pPaDFZQjVZNVAiLCJuIjoiVGVycmFmb3JtIiwiaWQiOjF9"
}
After that, you can run terraform init and terraform plan to check everything works (there is nothing to apply yet
though). We need to define our custom datasources, but as we saw above we cannot use grafana_data_source resources.
But don’t panic, here is where template_file and null_resources come to help! Using
both template_file (to create a template of payloads) and null_resource (to curl Grafana API) block we can create
many custom datasources:
resource "template_file" "my_azure_monitor_template" {
  filename = "azure_monitor_api_datasource.json"

  vars {
    name            = "AzureMonitorDS"
    client_id       = "${var.monitor_client_id}"
    subscription_id = "${var.monitor_subscription_id}"
    tenant_id       = "${var.monitor_tenant_id}"
    client_secret   = "${var.monitor_client_secret}"
  }
}

resource "null_resource" "my_azure_monitor_dashboard" {
  provisioner "local-exec" {
    command     = "curl -X POST -H \"Content-Type: application/json\" -H \"Authorization: Bearer ${var.grafana_token}\" -d'${template_file.my_azure_monitor_template.rendered}' ${var.grafana_url}api/datasources"
    interpreter = ["/bin/bash", "-c"]
  }
}
be sure you define all datasource variables required for this approach (client_id, tenant_id, etc.) as well as Grafana variables (grafana_url and grafana_token). In this case, instead of a plain json we will use template_file to allow variable interpolation (thus secrets are stored in .tfvars). Current template files (filename field on template_file resources):
azure_monitor_api_datasource.json
{
  "name": "${name}",
  "type": "grafana-azure-monitor-datasource",
  "access": "proxy",
  "url": "https://management.azure.com",
  "basicAuth": false,
  "isDefault": false,
  "jsonData": {
    "clientId": "${client_id}",
    "subscriptionId": "${subscription_id}",
    "tenantId": "${tenant_id}"
  },
  "secureJsonData": {
    "clientSecret": "${client_secret}"
  }
}
azure_insights_datasource.json
{
  "name": "${name}",
  "type": "grafana-azure-monitor-datasource",
  "access": "proxy",
  "url": "https://management.azure.com",
  "basicAuth": false,
  "isDefault": false,
  "jsonData": {
    "appInsightsAppId": "${app_insights_app_id}"
  },
  "secureJsonData": {
    "appInsightsApiKey": "${app_insights_api_key}"
  }
}
azure_datasource.json
{
  "name": "${name}",
  "type": "grafana-azure-monitor-datasource",
  "access": "proxy",
  "url": "https://management.azure.com",
  "basicAuth": false,
  "isDefault": false,
  "jsonData": {
    "appInsightsAppId": "${app_insights_app_id}",
    "clientId": "${client_id}",
    "subscriptionId": "${subscription_id}",
    "tenantId": "${tenant_id}"
  },
  "secureJsonData": {
    "appInsightsApiKey": "${app_insights_api_key}",
    "clientSecret": "${client_secret}"
  }
}
To create different datasources just change resource names (i.e., my_azure_monitor_template and my_azure_monitor_dashboard) and also on template_file resources update filename based on what kind of endpoint you wnat to monitor (Azure Insights and/or Azure Monitor API).
Summary
We manage to handle azure datasources using terraform resources in a different way (templates and null resources). This allowed us to close the circle and define our grafana installation 100% with code (terraform to provision infrastructure, ansible to install Grafana and configuration, and terraform again to provision Grafana datasources and dashboards).
To be said, this is just a shortcut for this particular issue (custom datasources not supported on Terraform). Ideally, what we should do is to extend terraform-grafana-provider to support custom datasources. Feel free to open an issue or implement it if you are familiar with go and terraform providers!
We found this issue interesting, but we know there is a long way to go. If you think on a different approach, or an improvement, please leave your comments on github or send us an email, we’d like to know about other options!